Blog 5: How to Build an Operations Performance Management Framework | The Local Edge
By Mark Grabow, Principal Consultant, Local Efficiency Solutions
Most local government managers, school district administrators, and community college leaders know they could benefit from an operations performance management (OPM) framework. The problem isn't a lack motivation, it's where to begin. It’s that every time someone in a local public sector organization tries to build an OPM framework, they have to start from scratch and bootstrap a robust tool with little more than theory available to help scaffold its structure. There's no ready-to-use tool designed specifically for public sector operations performance management. Well, there wasn’t, until now.
In Episode 5 of The Local Edge podcast, I introduce my flagship free tool, the Operations Performance Management Framework Template. It’s a free, 14-tab Google Sheets tool I developed from 20+ years of local-level public sector program and project management work across cities, community colleges, and nonprofits in Oregon and Nevada. It's prepopulated with departments typically found at local governments, K-12 districts, and community colleges, and it solves a problem I’ve encountered repeatedly in performance management work for the city management offices of Portland, Gresham, and Eugene: the existing frameworks are either great for reporting or great for strategy, but neither is built for day-to-day operations.
Prefer to watch/listen? Full Episode 5 here:
Why Every Local Public Sector Organization Needs a Real OPM Framework
Performance management isn't optional anymore. The International City/County Management Association (ICMA) identifies it as "key to efficient and effective local government service delivery" and one of the most critical tools for accountability, data-driven resource allocation, and transparency with the public. (ICMA, "Top Performance Management Resources," icma.org/page/top-performance-management-resources)
The challenge is capacity. Most smaller cities, school districts, and community colleges are running lean. A joint framework report published by NASACT, GFOA, ICMA, and the National League of Cities identified the core problem: effective performance management requires integrating four organizational processes — planning, budgeting, operational management, and evaluation. When those four aren't connected, the whole system suffers. (A Performance Management Framework for State and Local Government, GFOA/NASACT, 2009 — sfcontroller.org)
The solution isn't more complexity. It's having the right structure already built.
Framework 1: The Logic Model — Powerful for Reporting, Limited for Operations
If you've ever applied for a federal or foundation grant, you've used a logic model. The logic model was formalized by the W.K. Kellogg Foundation, whose Logic Model Development Guide remains the defining reference across public and nonprofit sectors. (W.K. Kellogg Foundation, Logic Model Development Guide — wkkf.org)
The flow: Inputs (budget, staff) → Activities (work being done) → Outputs (what gets produced) → Outcomes (changes achieved) → Impact (public benefit). Excellent for grant reporting, audit prep, and communicating with elected officials. I've used it myself — including when I developed a formal logic model for a Willamette Valley city's Service Profile Program Revamp.
But here's the limitation: the logic model is linear. It's a reporting tool, not an operational one. When you need to track what's happening across Finance, Public Works, and HR on any given week, the logic model doesn't get you there.
Framework 2: The Performance Management Pyramid — Strategic but Hard to Operationalize
Vision & Mission → Goals → Strategic Objectives → Strategies → Key Performance Indicators. This is excellent for top-down alignment. MRSC (Municipal Research and Services Center) identifies this kind of mission alignment as a core purpose of performance measurement in local government: supporting strategic planning, improving accountability, and allocating resources based on evidence rather than instinct. (MRSC, "Performance Measurement," mrsc.org/explore-topics/officials/strategic-planning/performance-measurement)
But it still leaves a gap. You can know your goal is "improve permit processing efficiency" without having any tool that tells you whether it's actually improving, department by department, week by week.
The LES OPM Template: Both Strategic and Operational in One Tool
This template does something I haven't found available anywhere for free: it combines the logic model structure with the performance pyramid into a single color-coded, hierarchically organized operational dashboard. It’s built to give you both the 20,000-foot executive view and the day-to-day departmental tracking you need.
This is the same conceptual approach I used when I redesigned the Unfunded Needs Assessment for the City of Eugene during my project management contract in their Finance Department (work published in the City's FY2021 Budget Document). When a councilor recognized the value of strategically aligning the unfunded items with departmental and council goals, color-coded for digestibility — it confirmed for me what the framework was designed to do: connect strategy to operations visibly and simply.
Inside the Tool: 14 Tabs, Three Org Types, Four Working Layers
The tool is structured around three organization types — Cities, Community Colleges, and K-12 Districts — each with four dedicated working tabs, plus a shared Instructions tab and a fully worked Example tab:
Tab Name + Purpose & Key Columns
Instructions = Step-by-step setup guide, org alignment diagram, and logic model crosswalk. Confirms how each tab maps to traditional OPM terms (Inputs, Outputs, Outcomes, etc.).
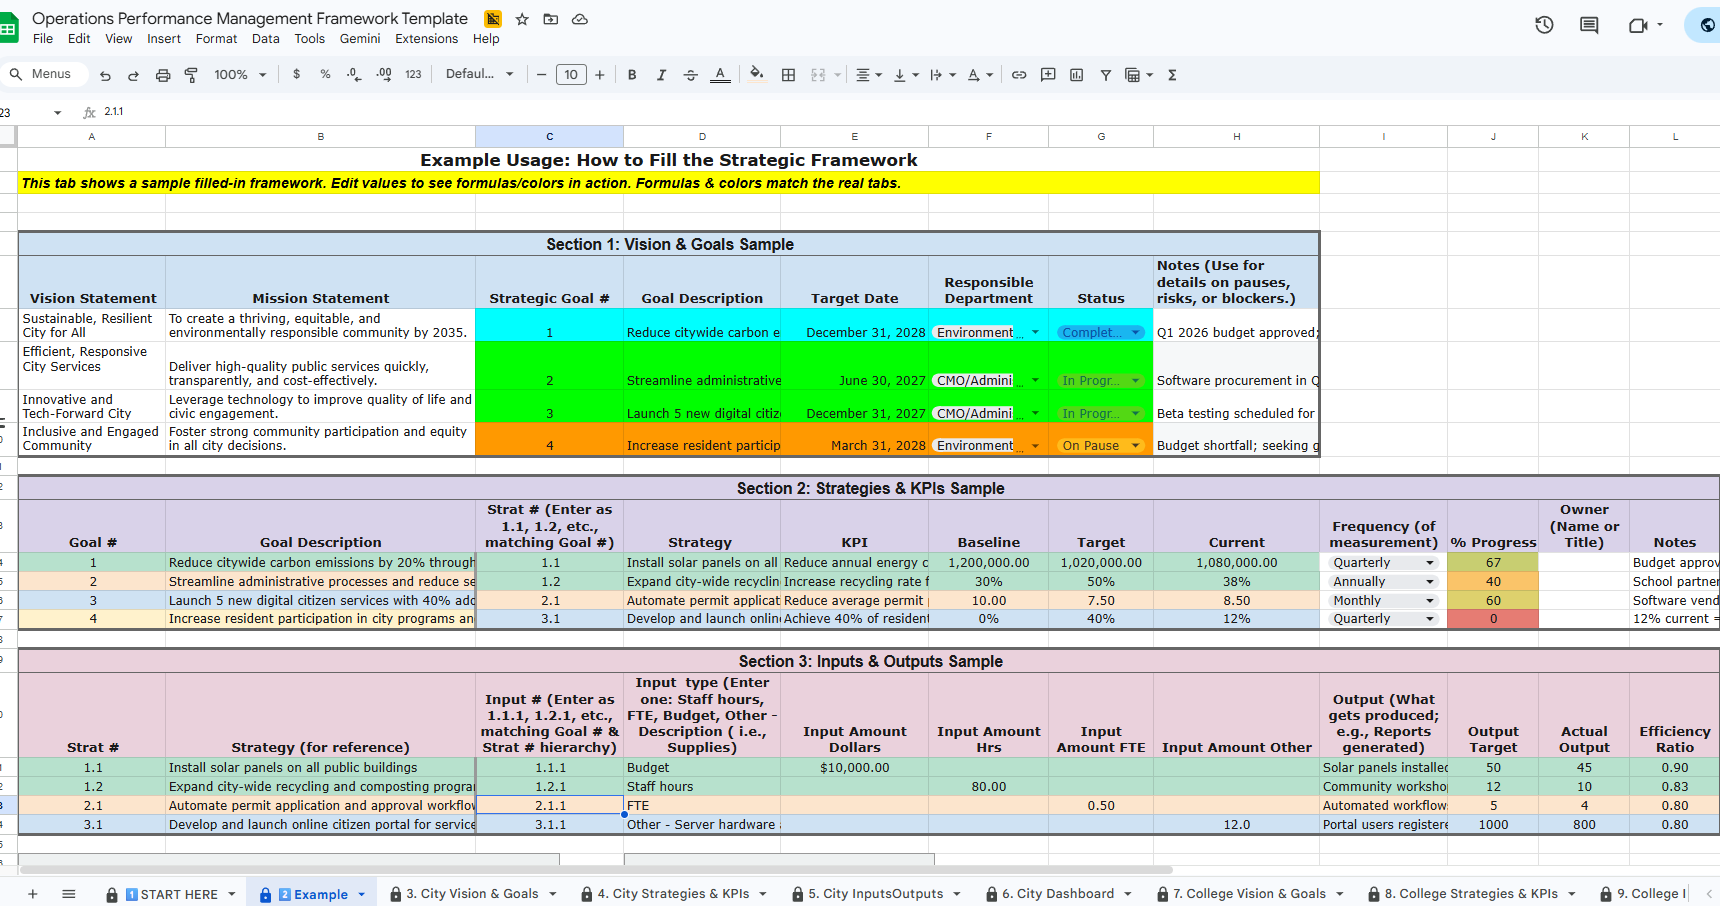
Example = A fully worked sample using a city sustainability scenario — carbon emissions reduction, permit processing, citizen portal. Use this to see all formulas and color-coding in action before touching your own tabs.
Vision & Goals = Columns: Vision Statement | Mission Statement | Strategic Goal # | Goal Description | Target Date | Responsible Department | Status | Notes. Start here — this anchors everything that follows.
Strategies & KPIs = Columns: Goal # | Goal Description | Strategy # (1.1, 1.2...) | Strategy/Activity | KPI | Baseline | Target | Current | Frequency | % Progress (auto-calculated). This is where strategy meets measurable accountability.
Inputs/Outputs = Columns: Strategy # | Strategy (reference) | Input # (1.1.1...) | Input Type (Budget/Staff Hours/FTE/Other) | Amount ($) | Amount (Hrs) | Amount (FTE) | Amount (Other) | Output | Output Target. One input per row, linked sequentially to strategies.
Dashboard =Auto-aggregates: Total Goals, Total Strategies, Total Inputs, Total Outputs, Average Efficiency score, Total $ / Hours / FTE / Other, % of Strategies with Inputs. Includes pivot table for nested drill-down. Title: "Traditional OPM / Logic Model Flow in This Template."
The Instructions tab also includes a logic model alignment crosswalk — showing exactly how each traditional OPM term maps to a tab in the template:
Traditional OPM / Logic Model Term + Where it lives in this template
Vision / Long-term Impact = Vision & Goals tab — Vision Statement column
Mission / Purpose = Vision & Goals tab — Mission Statement column
Outcomes / Results = Strategies & KPIs tab — KPI, Target, Current, % Progress columns
Activities / Strategies = Strategies & KPIs tab — Strategy/Activity column
Inputs = Inputs/Outputs tab — Input Type + Amount columns
Outputs = Inputs/Outputs tab — Output + Output Target columns
Efficiency / Productivity = Dashboard — Average Efficiency, % Strategies with Inputs
Continuous Improvement = Dashboard — drill-down pivot table; all tabs support ongoing updates
Getting Started in Four Steps
1. Open the tool and make your own copy (link below).
2. Choose your org type — City, College, or District — and delete the other two org-type tab sets. Keep the Instructions tab and the Example tab.
3. Start with your Vision & Goals tab. Enter your Vision Statement, Mission Statement, and Strategic Goals. Assign responsible departments and set status.
4. Work sequentially through Strategies & KPIs (linking to Goal #s), then Inputs/Outputs (linking to Strategy #s). Your Dashboard auto-populates as you go.
Operations Performance Management Framework Template
Translating traditional approaches into a tool for operational daily boots-on-the-ground management.
Live preview (read-only):
Get your own editable copy (free forever):
Why This Matters Now
Federal and state grant programs increasingly require documented outcome metrics tied to expenditures. Auditors expect clear linkages between organizational goals and resource allocations. And with constrained budgets and rising service demands, the organizations that thrive will be the ones that can clearly articulate what they're doing, what it's producing, and what impact it's having — with data to back it up.
A solid operations performance management framework is how you build that evidence base. You no longer have to build it from scratch.
Listen/Watch the Full Episode 5 (8 minutes)
Want access to the full set of FREE Local Edge tools? Click here:
Have questions about the tool or want help standing up a performance management program at your organization? Reach me at mark@localefficiency.com — always happy to chat.
Go forth and do good things.
— Mark Grabow, Founder and Principal Consultant
Local Efficiency Solutions, LLC