Free Operations Performance Management Framework for Cities, K-12 Districts & Community Colleges | Local Edge Tools
From The Local Edge Podcast Episode 5 — Build an Operations Performance Management Framework for Cities, K-12 Districts & Community Colleges
In 20+ years of public sector project management work across cities, community colleges, and nonprofits in Oregon and Nevada, I kept running into the same problem: the tools that exist for performance management are either great for reporting or great for strategy, but nothing bridges both into an operational daily-use framework. So I built one.
This free 14-tab Google Sheets workbook combines two foundational performance management frameworks — the Logic Model and the Performance Management Pyramid — into a single connected system that takes your organization from 20,000-foot Vision and Mission all the way down to department-level KPI tracking, input logging, and an auto-calculating efficiency dashboard. Pre-built for three organization types. Free to you.
The Operations Performance Management Framework
This tool was built from real work. I was allowed to unleash my approach and used a similar model of framework combination and goal alignment during a project manager (Management Analyst I) limited-term contract with the City of Eugene's Finance Department. The result was a redesigned Unfunded Needs Assessment that was published in the City's FY2021 Adopted Budget Document and recognized on the record by a city councilor for its goal alignment and color-coding. This is the evolved, open-sourced version of that framework, available free to any local public sector organization that needs it.
Free Operations Performance Management Framework Tool — City Dashboard view — Local Efficiency Solutions
Live preview (read-only): Click to open the live preview in your browser
Get your own editable copy (free forever):
What's Inside the Framework
The tool is structured around three organization types — Cities, Community Colleges, and K-12 Districts — each with four dedicated working tabs, plus a shared Instructions tab and a fully worked Example tab. Here's what each layer tracks:
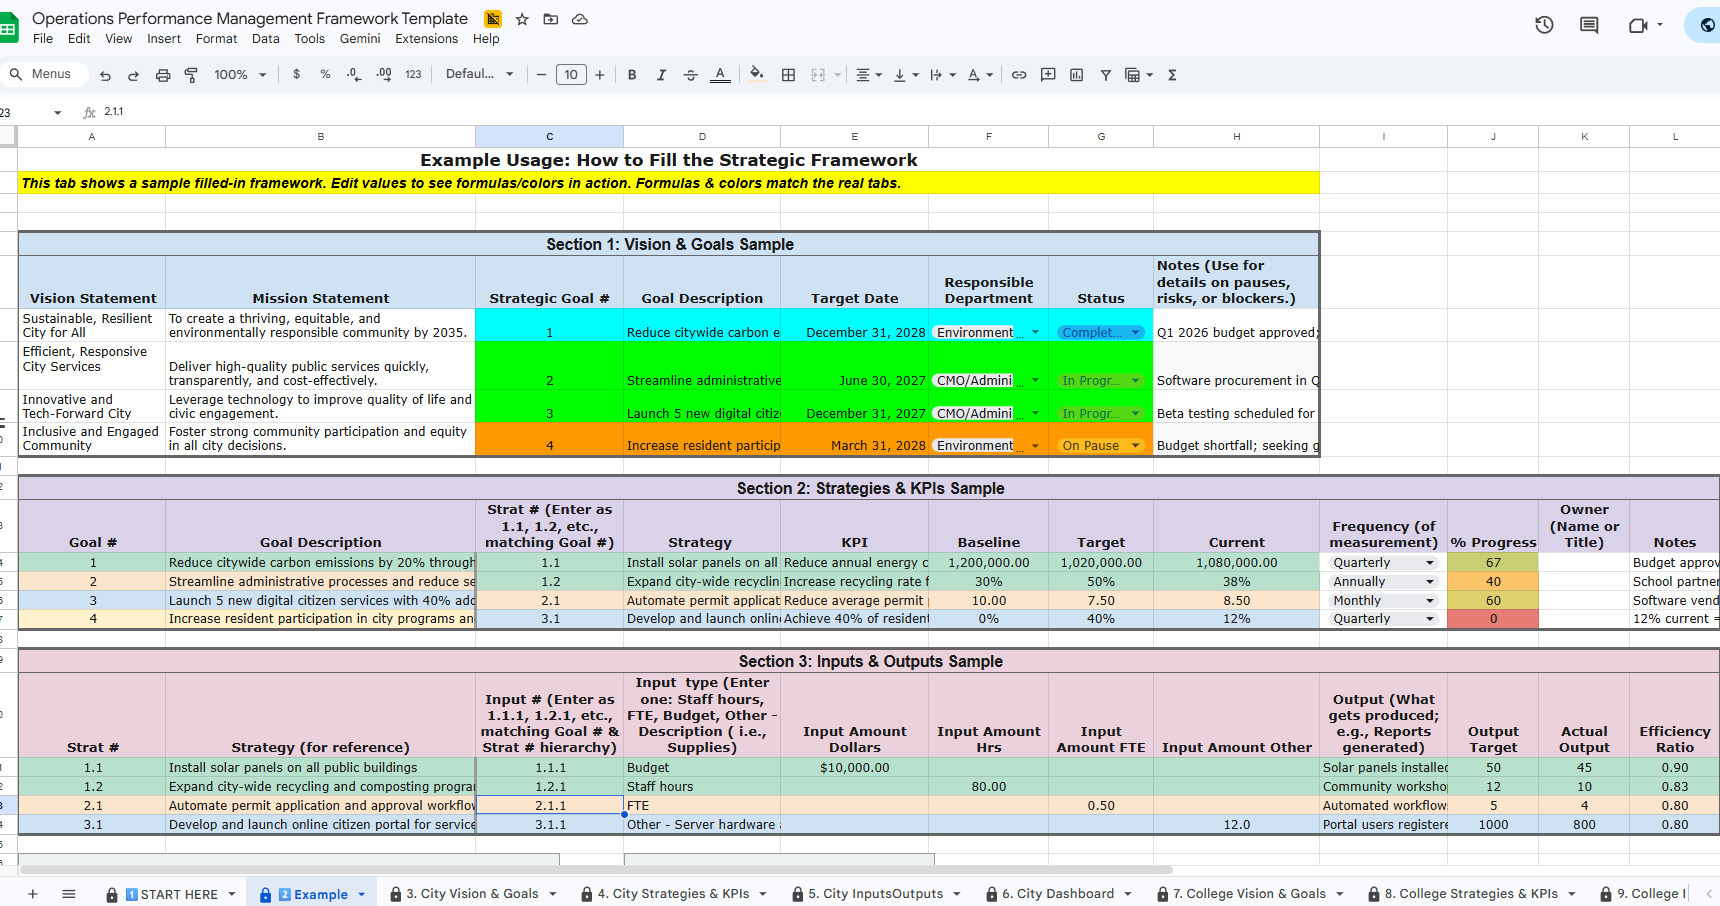
Vision & Goals tab — Enter your Vision Statement, Mission Statement, Strategic Goals, Target Dates, Responsible Departments, and Status. Rows automatically color-code green (Completed), amber (In Progress), red (On Pause / Issue), and gray (Not Started) using RAG status formatting — the same traffic-light system used in council and board performance reporting.
Strategies & KPIs tab — Link every strategy to a Goal number using the sequential numbering system (Goal 1 → Strategy 1.1 → Input 1.1.1). Track KPI, Baseline, Target, Current value, Frequency of measurement, % Progress (auto-calculated), and Owner — the individual responsible for updating each strategy.
Inputs / Outputs tab — Log budget dollars, staff hours, FTEs, and other resources against each strategy. Record what gets produced (outputs), your output targets, actual outputs, and an auto-calculated efficiency ratio.
Dashboard tab — Auto-calculates Total Goals, Total Strategies, Total Inputs, Total Outputs, Average Efficiency score, and the percentage of strategies with documented inputs. A living scorecard for your entire organization.
The tool also includes a Start Here tab with a four-step setup guide, an Instructions tab with a complete Logic Model crosswalk showing how each traditional OPM term maps to a specific tab and column, and a fully worked Example tab using a city sustainability scenario — so you can see every formula and color-coding system in action before entering your own data.
Getting Started in Four Steps
Open the tool and make your own copy using the link above.
Choose your org type — City, College, or District — and delete the other two org-type tab sets. Keep the Start Here, Instructions, and Example tabs.
Begin with your Vision & Goals tab. Enter your Vision Statement, Mission Statement, and Strategic Goals. Assign responsible departments and set status.
Work sequentially through Strategies & KPIs (linking to Goal numbers), then Inputs/Outputs (linking to Strategy numbers). Your Dashboard auto-populates as you go.
Questions about the tool or need help standing up a performance management program at your organization? Reach out directly; I'm happy to help.
mark@localefficiency.com | (541) 450-9439
Want access to the full set of FREE Local Edge tools for all you public sector efficiency warriors? Click here:
Related Episode & Blog Post
This tool was built alongside Episode 5 of The Local Edge podcast. For the full walkthrough, including the history of the Logic Model, the Performance Management Pyramid, and how I combined both frameworks into this tool, watch the episode or read the condensed blog post.
Go forth and do good things.
— Mark Grabow, Founder and Principal Consultant Local Efficiency Solutions, LLC